Data Abstraction 을 하면 domain 에 dependency 없이 디자인을 여러 분야에 걸쳐 활용할 수 있음
Why do Data Semantics and Types Matter
•
Semantics: Real-World Meaning
•
각 attribute 이 어떤 type 이고 어떤 의미를 가지는가가 시각화에 있어서 중요함
•
Type of the data: Structural or Mathematical Interpretation
◦
Data Level: Data Types
◦
Dataset Level: Dataset Types
◦
Attribute Level: Attribute Types
▪
어떤 math openration 이 이 attribute 에 행할 수 있고 의미 있는 operation 인가?
Data Types
•
Attribute
•
Item
•
Link
•
Grid
•
Position
Dataset Types and Data Types
•
Dataset: collection of info that is the target of analysis
•
Tables (Dataset) — items, attributes (Data)
◦
Basic Dataset Types
◦
attribute 는 field, variable, dimension 으로도 불림
◦
cell contains values: quantitative, ordinal (순위 같은 것들), nominal (이름 같은 것들)
•
Networks & Trees — items(nodes), links, attributes (Data)
◦
Basic Dataset Types
•
Fields — grids > positions, attributes
◦
Basic Dataset Types
◦
특정 spatial positions 에서의 sampling 에 기반한 cell structure → Grid Type 이 필요
•
Geometry — items > positions
◦
Basic Dataset Types
◦
item 의 shape 와 explicit 한 spatial position 을 같이 나타내주는 정보
•
Combinations: Clusters, Sets, Lists — items
Abstraction and Availability
•
Data Abstraction
◦
Domain Specific to GENERIC
•
Data Availability
◦
static File: available all at once
◦
dynamic streams
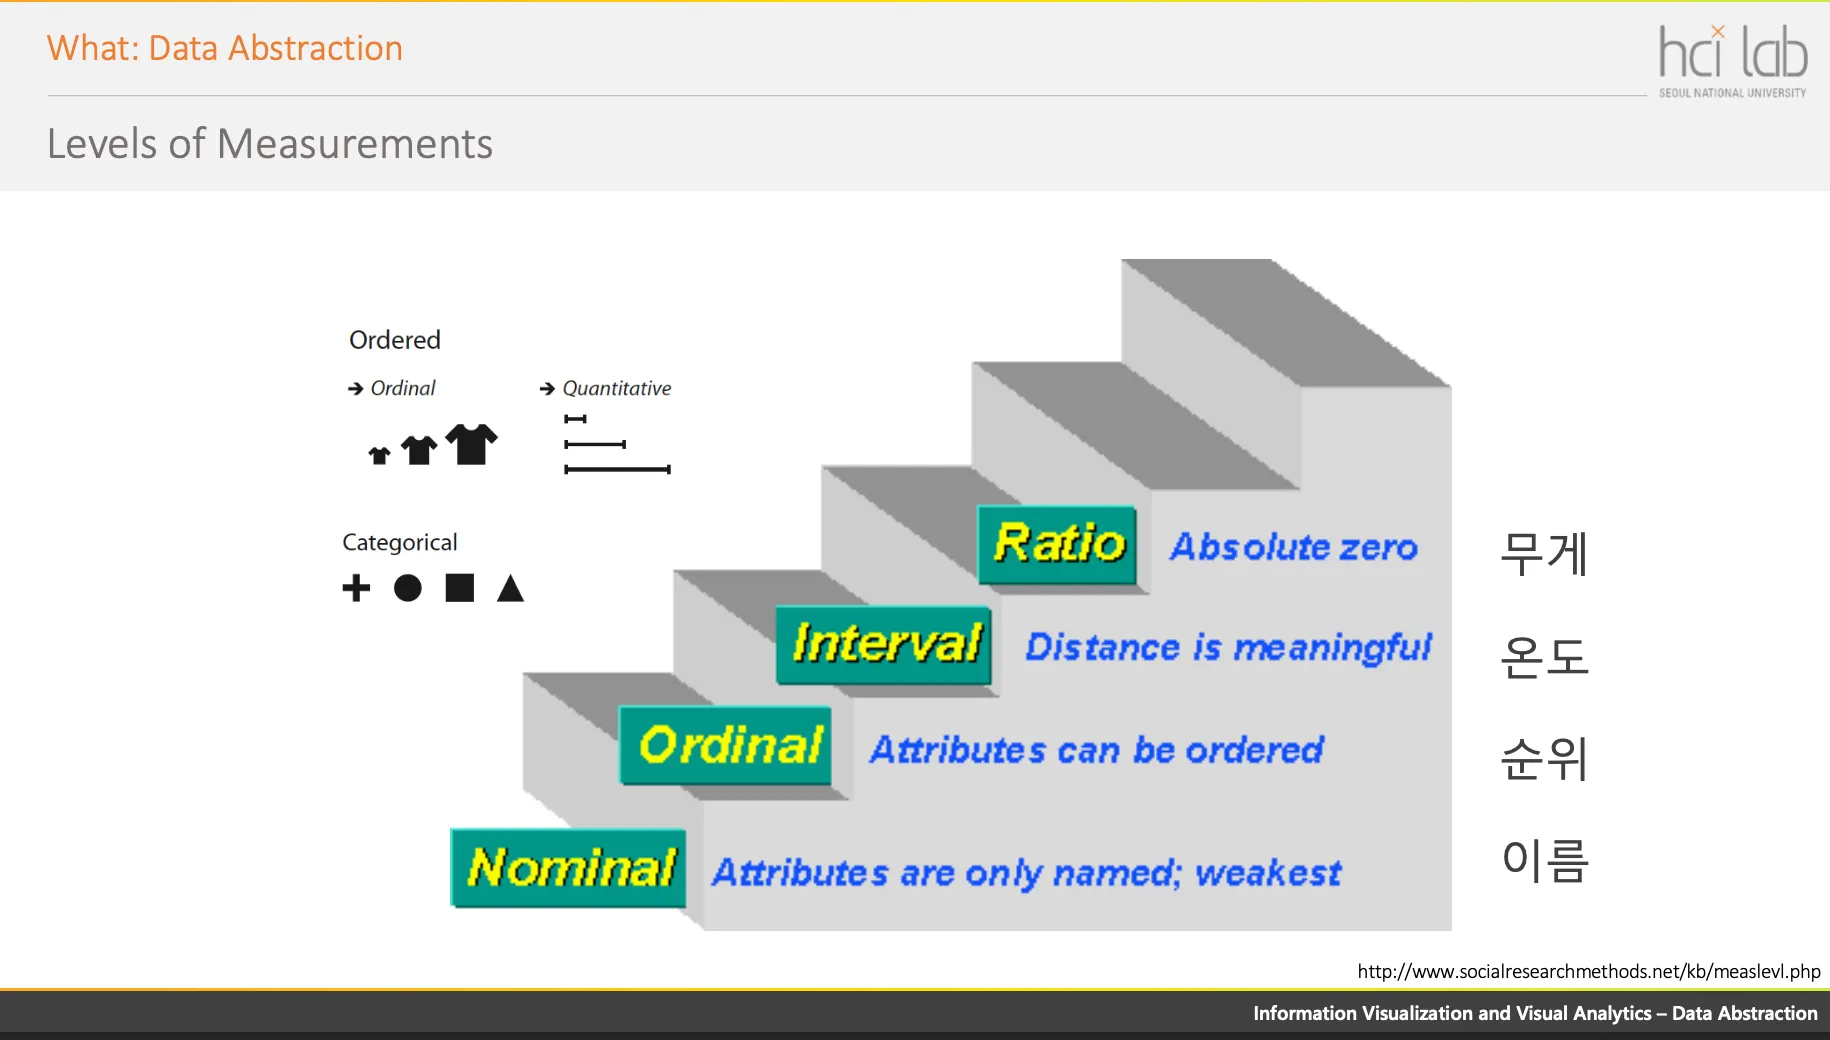
Attribute Types
•
Categorical
•
Ordered
◦
ordinal
▪
ordering direction: sequential, diverging, cyclic
◦
quantitative
Levels of Measurements
Semantics: Key vs. Value Semantics
•
Flat Tables: only one key
•
Multidimensional Tables: multiple keys required
•
Fields
◦
Scalar Fields: univariate — one attribute per cell
◦
Vector Fields: multivariate with a list of multiple attribute values at each point
◦
Tensor Fields
Semantics: Temporal Semantics
•
Temporal Attribute: any info relates to time
Task Abstraction
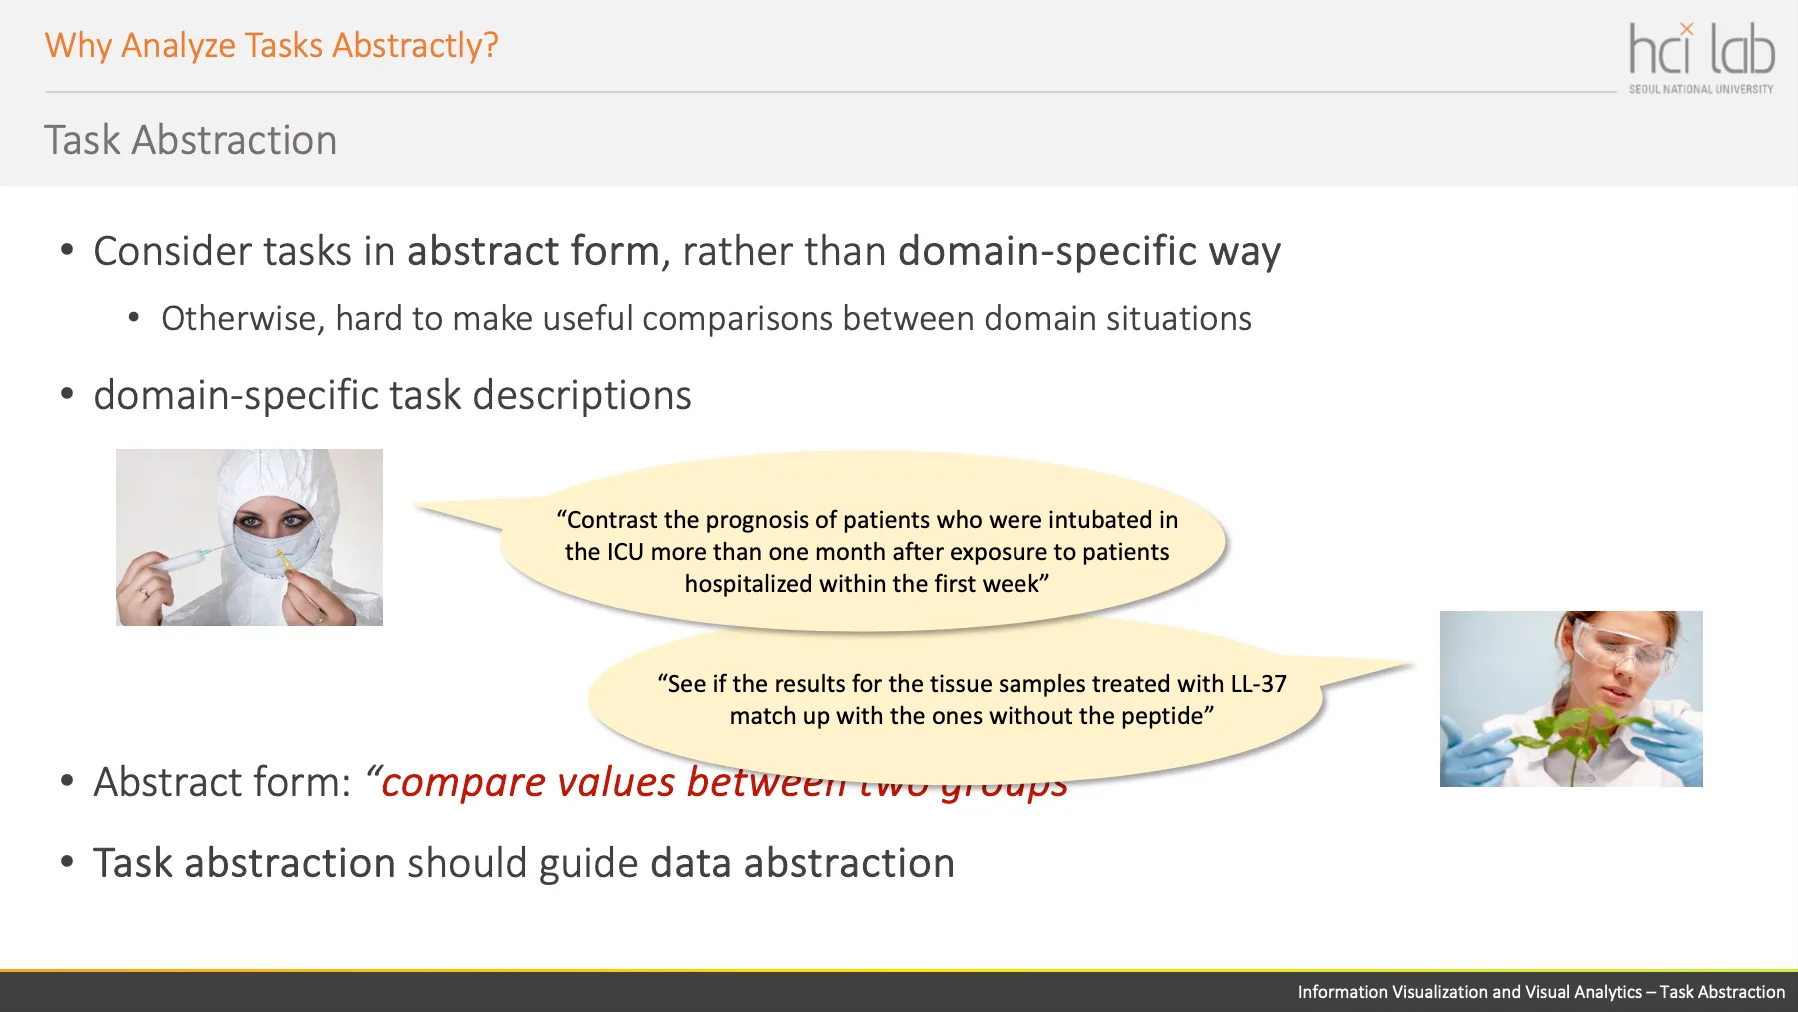
•
다른 두 말이지만, 본질 (abstract form) 은 두 그룹간의 비교를 하라는 것임
•
좋은 시각화는 abstract form 에서부터 나옴
Actions Define User Goals!
High-Level: Analyze — Consume
•
Discover (=explore)
◦
이전에 알려지지 않은 지식을 찾는 것
◦
새로운 가설을 새우거나, 기존에 존재하는 가설을 검증
•
Present (=explain)
◦
•
Enjoy
High-Level: Analyze — Produce
•
Annotate
◦
시각화를 만든 상태에서 어떤 특정 부분에 설명을 다는 것
•
Record
◦
시각화의 읿부분을 캡처, 로그를 가져오는 행위
•
Derive
◦
데이터를 있는 그대로 visualization 하는 것 — 하수의 visualization
◦
있는 데이터 가지고 새로운 데이터 element 를 만들어 시각화 하는 것 — 고수의 visualization
▪
e.g., 수출, 수입 내역만 가지고 적자 수준이라는 새로운 데이터를 만들어냄
Mid-Level: Search
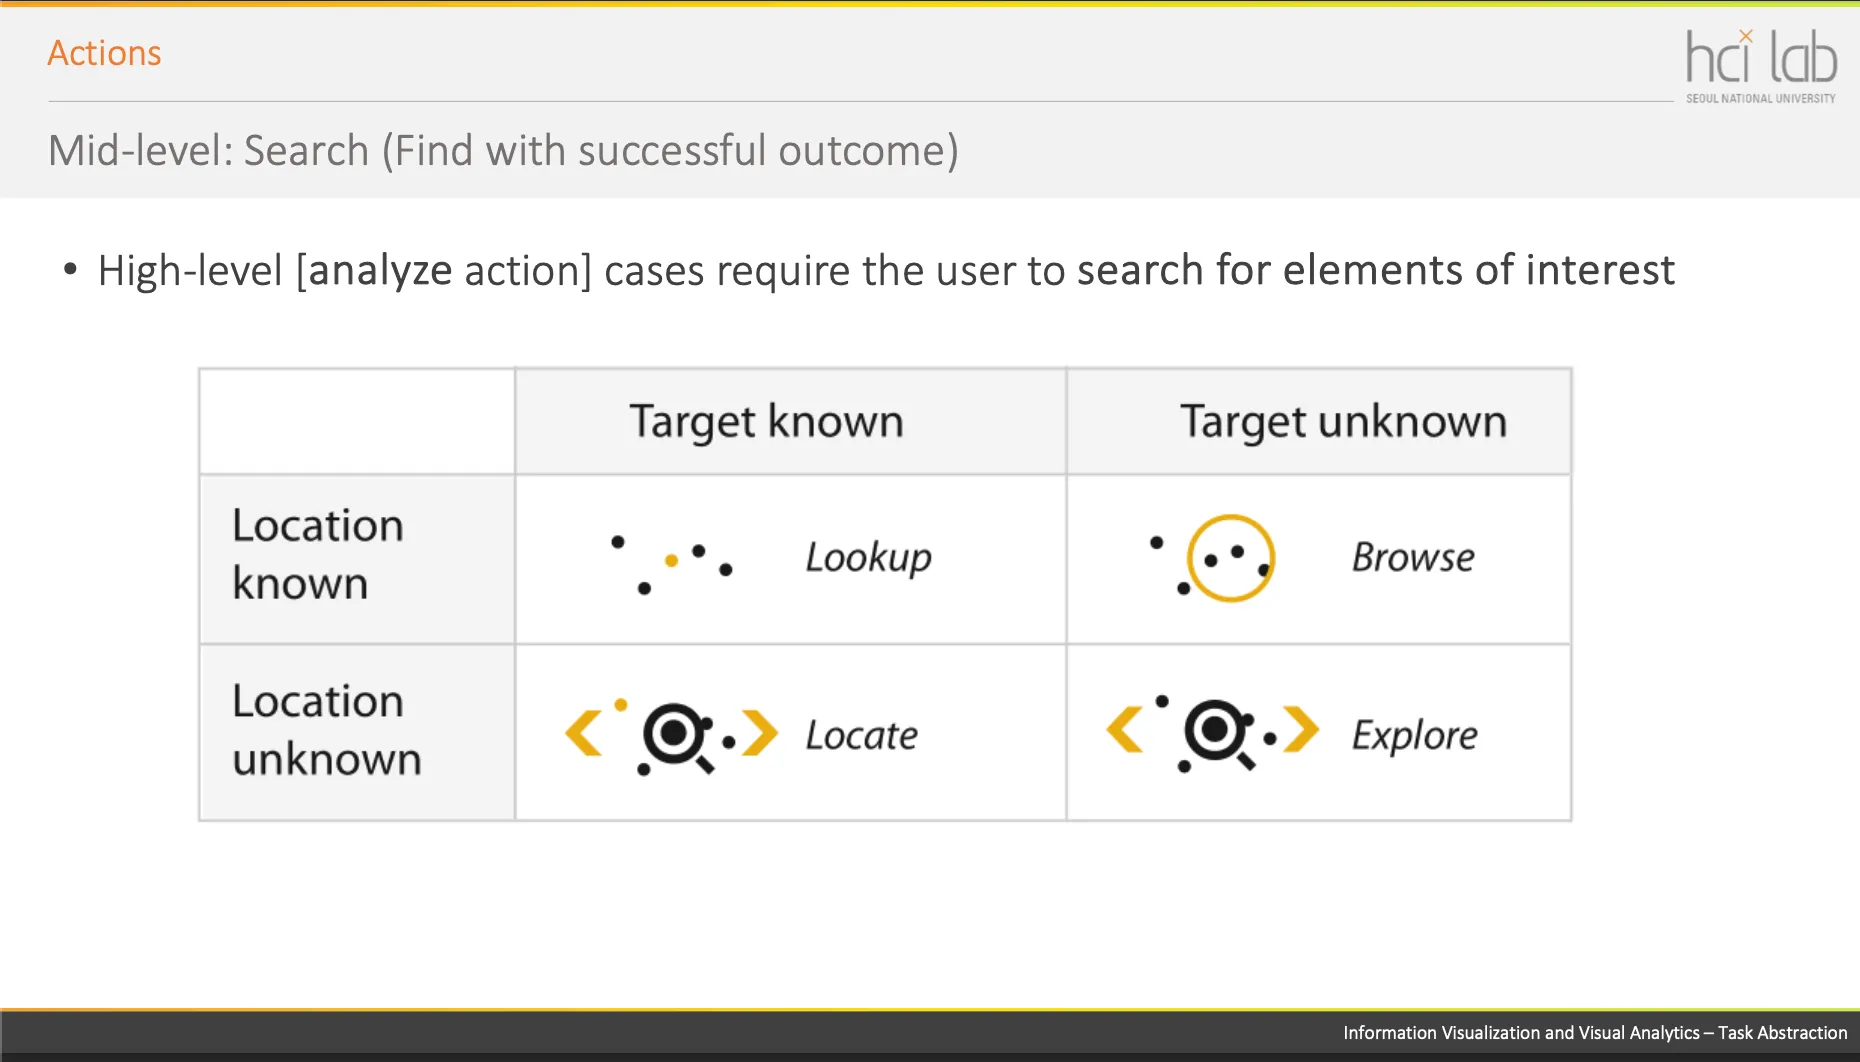
•
Explore: 뭘 찾아야하는지도, 어딨는지도 모르지만 일단 주변을 탐색해보는 것 (e.g., 오지에서 살아남기)
Low-Level: Query
•
찾아야될 target 이 나온다면, target 을 query 해야 함
•
Identify — single target
•
compare — multiple target
•
summarize / overview — all possible targets